 OpsCommand
The product areas
Eight areas. One record.
OpsCommand is one record seen through eight working areas. Each team opens its own; every one of them reads and writes the same services, incidents and reports.
Area by area
Built for the work each team does.
- 01
Executive Command Dashboard
The condition of every digital service on one page: what is down, what is major, what keeps failing, and how fast it is resolved.
Used byLeadership
In the product - 02
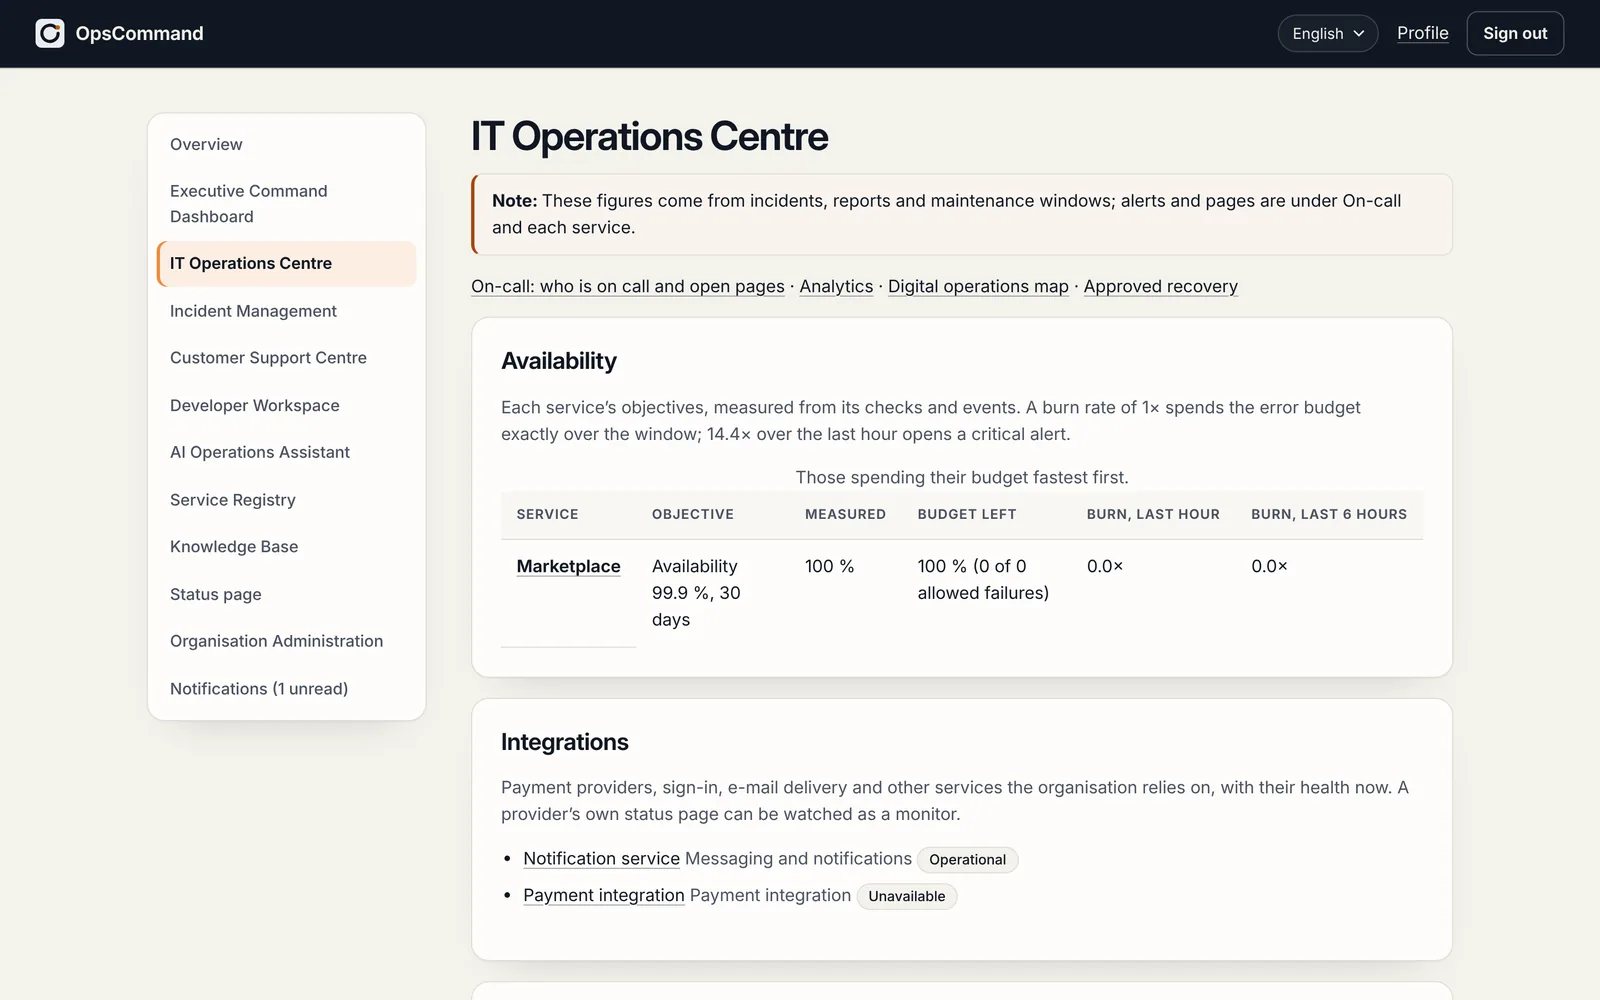
IT Operations Centre
Queues, availability against each service’s objectives, on-call and paging, trends, and analytics computed from the records.
Used byIT operations
In the product - 03
Incident Management
Every incident through one lifecycle of eleven statuses, with its timeline, roles, links, verification of the fix, the review afterwards — and regulatory reports where the law asks for them.
Used byEveryone who works an incident
In the product - 04
Customer Support Centre
Reports from customers and staff — support page, widget, e-mail — in one queue, linked to incidents, with a private link for the reporter to follow it.
Used byCustomer support
In the product - 05
Developer Workspace
Incidents become structured engineering tasks with the evidence attached, linked to issues, pull requests and deployments, until the fix is verified in production.
Used byEngineering
In the product - 06
AI Operations Assistant
Off unless the organisation turns it on. It suggests, drafts and summarises from the records, with its sources; it decides nothing, and every output is labelled and logged.
Used byEvery team, once it is turned on
You turn it on - 07
Service Registry
Every product, service and component, with its owners, dependencies, documents, objectives and monitors: the map everything else stands on.
Used byIT operations and service owners
In the product - 08
Knowledge Base
What was learnt, verified and versioned, offered when a similar incident comes back.
Used byEveryone
In the product
What it watches
Six kinds of service. Watched the same way.
Choose an area to see what OpsCommand checks in it and which tools it works with.
IT infrastructure
Servers, networks and databases, seen through the services they run.
What it watches
- Your own systems confirm, on a schedule, that they are alive
- Certificates and domain names before they expire
- Errors your applications report
Works with
- OpenTelemetry
- Webhooks
Cloud and hosting
The providers and platforms your services run on.
What it watches
- The payment, e-mail and sign-in providers you rely on
- Every new release, as it goes live
- In our cloud, or on your own servers
Works with
- GitHub
- GitLab
- Webhooks
Websites and applications
What your customers actually use.
What it watches
- Whether each page is up, correct and fast
- Sign-in, booking and checkout, tried step by step
- Errors and what customers report
Works with
- OpenTelemetry
- Webhooks
Software development
From the fault to the code that fixes it.
What it watches
- Faults handed to developers with the evidence
- The code change linked to the incident
- A fix released, then checked before closing
Works with
- GitHub
- GitLab
- Jira
Business-critical processes
The journeys and workflows revenue depends on.
What it watches
- The journeys your customers pay through
- Which business process an incident hurts
- The service levels you promise
Works with
- Slack
- Microsoft Teams
- Webhooks
Operational security
Control and evidence around every incident.
What it watches
- A record of every change that cannot be altered
- NIS2, GDPR and DORA reporting deadlines
- Your data kept apart from everyone else’s
Works with
- Entra ID
- Okta
- Google Workspace
- SAML · SCIM
Built to connect with the tools your teams already use
- Code and issuesGitHubGitLabJira
- ChatSlackMicrosoft Teams
- SignalsOpenTelemetryWebhooks
- Sign-inEntra IDOktaGoogle WorkspaceSAML · SCIM
In the product
The IT Operations Centre, as it is today.
See OpsCommand on your own services.
A 45-minute walkthrough with the people who run your services: one incident, from first alert to verified fix.
